Last month, New York City became the first jurisdiction in the U.S. to publicly post energy efficiency information for its building stock. The data—a maze of mind-numbing Excel tables—is hard to sort through. But it’s a critical first step to opening up energy transparency in the real estate market.
As we’ve noted, benchmarking and disclosing energy efficiency info is a rapidly growing trend among U.S. cities. In Europe, this kind of data is already available on a national scale. Many of the countries that drafted rating policies at the behest of the EPBD Directive also created national databases for Energy Performance Certificates (labels relating a building’s relative efficiency) that are public and web-searchable.
As of 2010, the Building Energy Performance Institute Europe reported that the list includes Denmark, Belgium (Flanders region), Ireland, Portugal, and the Netherlands. But the U.S. isn’t far behind, especially given that we have many more buildings to accommodate, diverse local requirements for energy performance reporting, and ambitious open data plans.
SEED
The Standard Energy Efficiency Data (SEED) Platform is a nearly-realized project from the U.S. Department of Energy. Its purpose is to provide a free building energy data management tool to governments sifting through reported data. It’s designed to be flexible and accommodating—the database can handle quantitative or qualitative information and, most importantly, data can be pulled automatically by researchers or by other sites for graphic display.
It’s a pretty serious endeavor, if hard to visualize right now. But this data has incredible potential for innovative uses and visualizations…
Using the Data
One example of how this data can be used is HonestBuildings.com, a site that uses energy performance data to support a vast green-building network. Part business network, part advertisement, part social media, the site allows tenants to review their buildings, buyers to review building energy performance, and managers to find qualified local contractors.
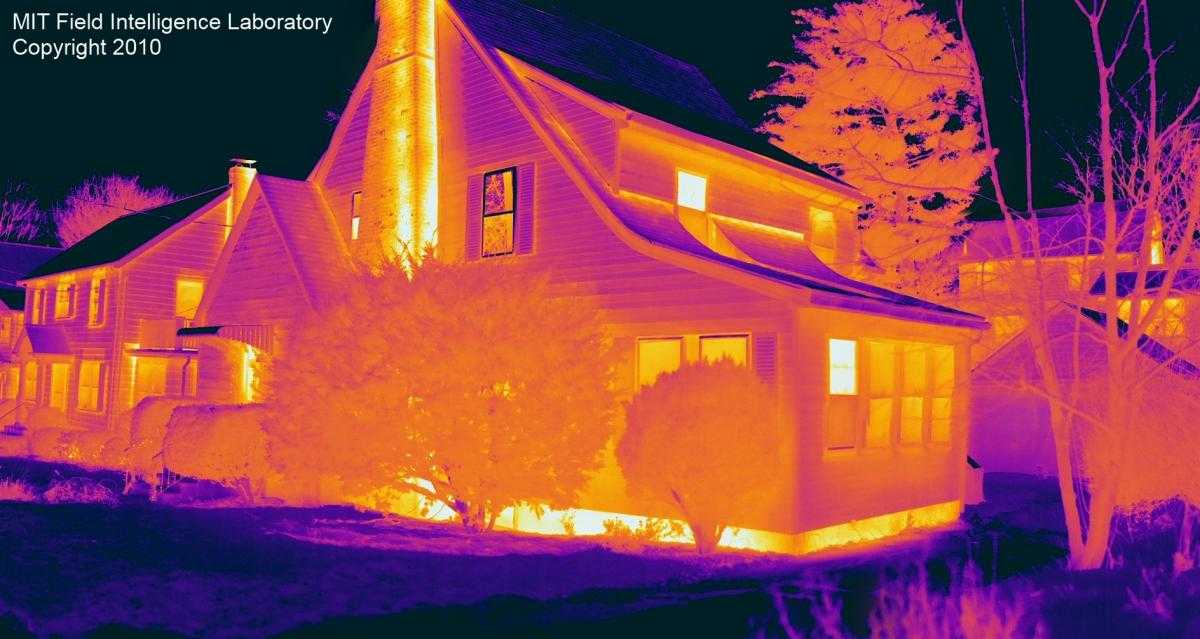
Another utilization will be in targeting energy services. Already, efficiency companies in Massachusetts are using thermal imaging (see photo below) on a neighborhood scale to identify energy-inefficient homes.
Visualizations for large buildings using SEED data would be slightly different, but creative adaptations of the data (combined with Google Maps and other geographic tools) could enable a powerful new way to depict energy performance.
Other Possibilities
Yet another possibility for this data is as a research tool. The U.S. Green Building Council is developing a new data platform called the Green Building Information Gateway (GBIG), which allows users to track all kinds of environmental info geographically. With data feeds from SEED and other open systems, tools like GBIG could show you correlations between energy use, LEED ratings, sale prices, and park access.
Visualization
One last takeaway is that SEED energy data will be pulled to create visualizations of building stock for lots of purposes, including business development, research, education, advocacy, and urban planning. As more and more places gather data, this platform will become a more powerful and flexible tool.