Data is increasingly important for allowing us to understand the impacts of climate change in communities across the globe, and helping us visualize the results of our behavioral changes. Each year, hundreds of reports detail the ways in which our world is changing, from global increases in greenhouse gas emissions to the benefits of electrification in our energy transition. At IMT, data is essential to our work.
This staff profile features IMT alum, Andrew Feierman, former IMT Program Manager for Private Engagement, who discusses some of his current work with data for the Trase program at the Stockholm Environment Institute, which helps people visualize how trade and supply chains are linked to deforestation. He also shares his hopes for data deployment in the near future.
What is one defining moment in your life where the reality of climate change became personal to you? How does your current role at the Stockholm Environment Institute address some of the world’s current climate challenges?
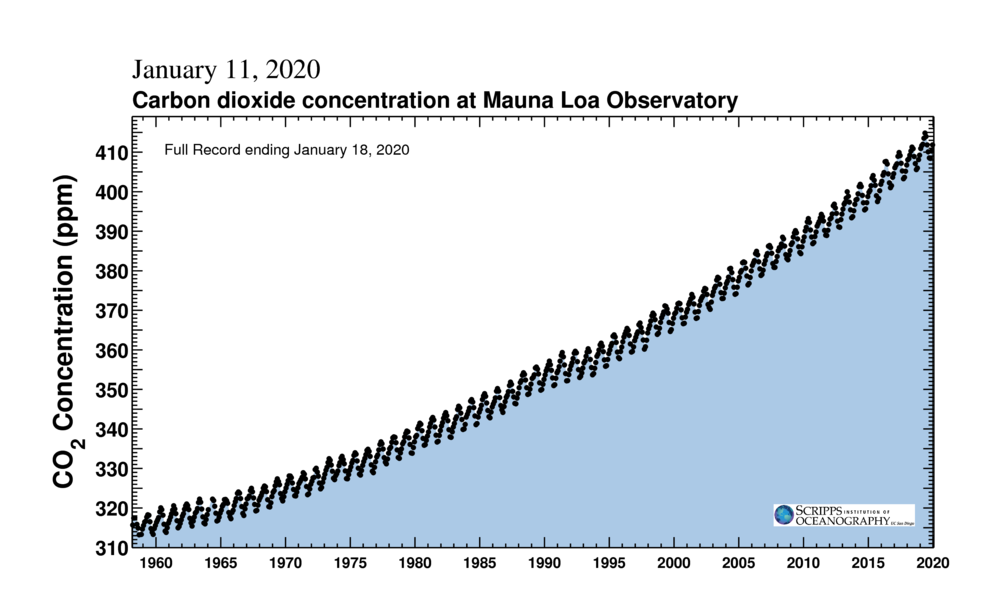
In college, I took a physics class called “Earth Systems Science” which covered the physics of large-scale systems within the earth and the atmosphere. One day, we were going over atmospheric systems and the Keeling Curve was shown on the screen, and for me, that’s the moment when climate change went from an abstract concept to something that I wanted to work on. For data-driven people [the Keeling Curve] can be the visual that lets you know that there is a problem with carbon in our atmosphere and that problem is getting worse at an unprecedented rate.
After college, I worked at a consultancy that worked on the ENERGY STAR program, an EPA brand that broadly covers energy efficiency. I then came over to IMT and was able to narrow my focus on energy efficiency for buildings, which was wonderful in so many ways. IMT takes a very large and amorphous issue like tackling climate change and makes work bite-sized and easier to make progress on. That’s one of the things that I love about IMT, that a very clear focus leads to very clear goals.
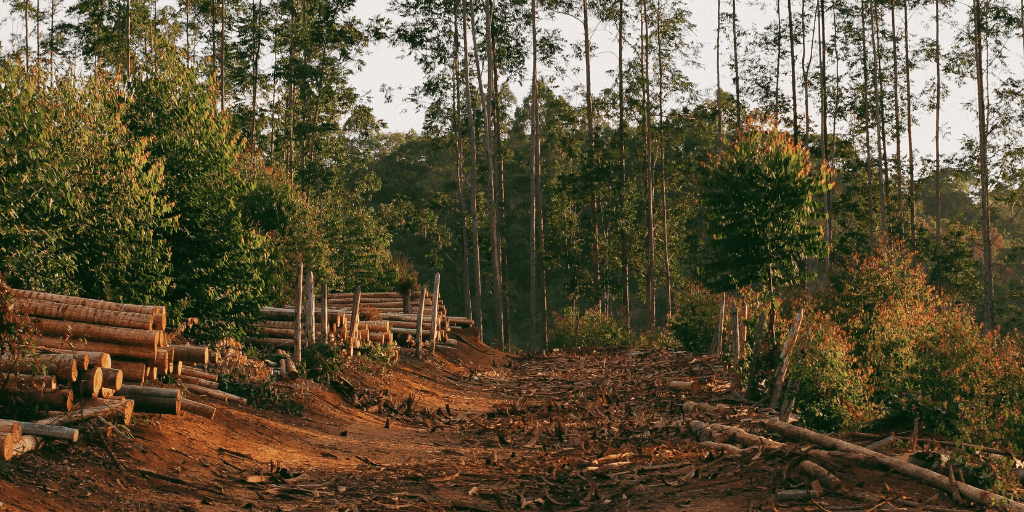
Now, I work for a group called the Stockholm Environment Institute as a data scientist on a project called TRASE, which is an acronym for Transparent Supply Chains for Sustainable Economies. Essentially, what we do is combine trade data with satellite imagery and other datasets to model how shipments and purchases of different commodities are related to deforestation. If you’re interested in checking out TRASE, you can get a better sense of the project at TRASE.earth.
How did your previous work experience at IMT help lead you to your current role at the Stockholm Environment Institute?
When I started working at IMT, I was not a data scientist. While I had some background in math and physics, my core work was on the private markets team and focused on green leasing. But, IMT’s core work is data-intensive, and over time I was exposed to the many different areas where we rely on and generate valuable data sets. The core work [at IMT] is all about getting and sharing information related to energy consumption. One important role for a data scientist is to communicate complex ideas and analysis to non-technical audiences, and working at IMT helped me hone that skill.
One of your biggest roles as a data scientist is to communicate complex ideas and analysis to a non-technical audience. What are some of the ways that you do this?
When it comes to communicating ideas, I tend to think of what is called the “five levels” concept. To really understand something, you may start with a really advanced insight that only a professional would comprehend, and then roll things back to be more and more simplistic. So, first, you need to be able to explain something to a professional; then maybe you want to explain something to someone who has an undergraduate degree; then you take that explanation and you make it even more focused to, say, a sixteen-year-old in high school; then you can walk that back to a ten-year-old; then a five-year-old. If you really understand the concept, you should be able to explain it to a kid with no problem. This concept of having different levels of explanations is perhaps my main tool to take what are often very complex ideas and then roll them back to be more accessible to a wider audience.
How do you think data deployment can strengthen efforts for energy efficiency? What are some ways this could happen in the near future?
When I left IMT, the next frontier was getting deeper into buildings and working on submetering and measuring individual systems within buildings. There are lots of groups that are working on that right now, and as is always the case with energy efficiency and the progression of that technology, they tend to be focused on buildings in major markets, such as New York. Now that we’re measuring whole buildings and getting better at that, the next step is managing peak loads and working with individual building systems to understand how they work in conflict with each other, and to better measure those pieces of the puzzle.
“As we approach the next frontier for energy efficiency—submetering better and measuring building systems better—it’s going to be more important for people to effectively communicate where buildings are wasting energy and how systems can be improved.”
Once you’re measuring things at a more granular level, you’re going to have more data, which is going to get harder to distill into actionable insights. As we approach the next frontier for energy efficiency—submetering better and measuring building systems better—it’s going to be more important for people to effectively communicate where buildings are wasting energy and how systems can be improved. I think data scientists and their roles in energy and energy efficiency are going to increase in the coming years.
To meet more IMT staff, visit www.IMT.org/staff.