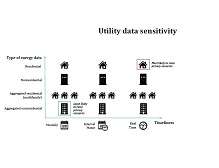
This graphic presents the relative sensitivity of energy data from utility meters, from the most private and sensitive (real-time, household-level) to the least sensitive (monthly, nonresidential, and aggregated).
This graphic presents the relative sensitivity of energy data from utility meters, from the most private and sensitive (real-time, household-level) to the least sensitive (monthly, nonresidential, and aggregated).