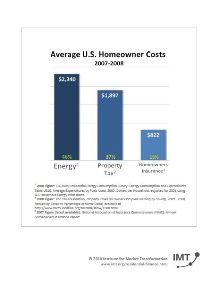
2008 Figure: EIA 2005 Residential Energy Consumption Survey: Energy Consumption and Expenditures Table US10. Average Expenditures by Fuels Used, 2005, Dollars per Household, adjusted for 2008 using BLS Household Energy Price Index.
2008 Figure: The Tax Foundation, Property Taxes on Owner-Occupied Housing by County, 2005 – 2008, Ranked by Taxes as Percentage of Home Value, available at http://www.taxfoundation.org/taxdata/show/1888.html.
2007 Figure (latest available): National Association of Insurance Commissioners (NAIC), Annual Homeowners Insurance Report.